Who Has Covid Right Now In The UK?
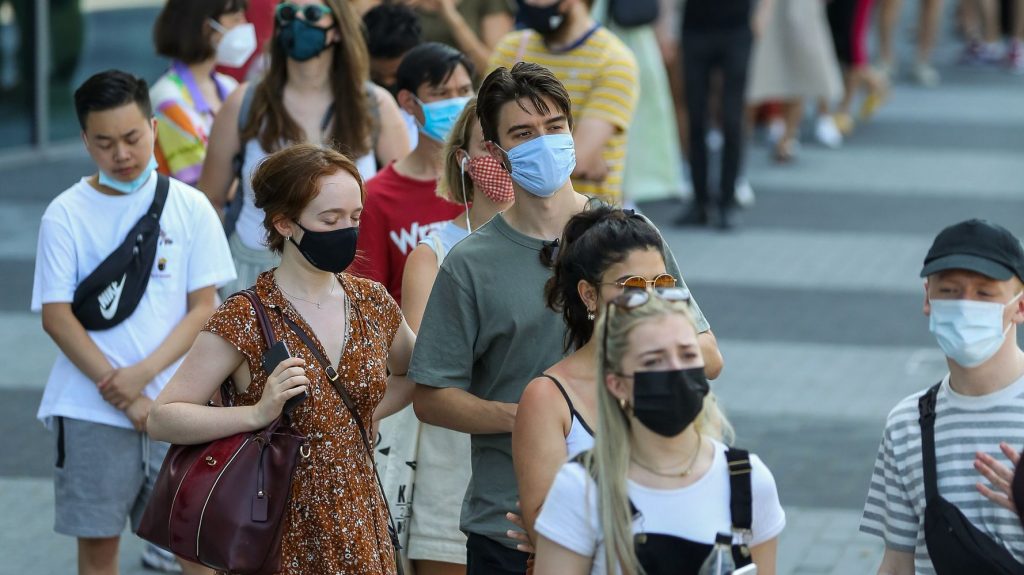
Rising Covid cases means the UK has become one of the worst hotspots for the virus in the world in recent weeks.
The government is currently resisting calls to implement restrictions in a bid to curb the virus, and has repeatedly claimed the timing is not right for another lockdown.
Although 86% of the population aged 12 and above have received at least one vaccine dose – and 79% have received both doses – concerns about ongoing cases has led NHS representatives to call for Downing Street to enact plan B for the winter.
But for now, prime minister Boris Johnson is relying on the booster vaccine rollout to help keep the virus at bay among the most vulnerable.
Health secretary Sajid Javid also appealed for the public to wear their masks more often and announced that the government is going to buy antiviral drugs to tackle Covid.
So just who has Covid at the moment, and which areas are suffering the most?

PA GraphicsPress Association Images
Breakdown of cases by area
Source: coronavirus.data.gov.uk
Covid cases by nation from highest to lowest by rate per 100,000 of the population for the last seven days:
Covid cases by region, from highest to lowest by rate per 100,000 of the population for the last seven days:
Yorkshire and The Humber: 492.1
Top 10 local authorities with the highest Covid rates by rate per 100,000 of the population for the last seven days:
1. Bath and North East Somerset: 877
6. Vale of Glamoran: 768.7
10. Neath Port Talbot: 736.2
Top 10 local authorities with the lowest Covid rates by rate per 100,000 of the population for the last seven days:
1. Shetland Islands: 78.7
4. Na h-Eileanan Siar: 154.7
5. Hackney and City of London: 162.4

PA GraphicsPress Association Images
Cases according to age group
Source: ons.gov.uk – data from 29 August until 9 October
Most cases are among those in the school year 11 and younger.
Age 2 to school year 6: 3.1%
School year 7 to 11: 8.1%
School year 12 to age 24: 1.1%
Cases by age and vaccination status between September 15 and October 6:

PA GraphicsPress Association Images
About Author